干法提取的鹰嘴豆蛋白浓缩物在3.0% w/v浓度下表现出高蛋白含量、良好的起泡性能以及对纳米乳液的有效稳定作用。结构与热分析表明其以无定形结构为主,残余结晶度低,分子柔韧性增强,证明其适合作为可持续的植物源功能性成分用于食品胶体体系。
研究文章
基于空气分级干法分离对鹰嘴豆蛋白浓缩物结构、热学及功能特性的影响及其在纳米乳液中的应用
在新标签页中打开
本文内容
摘要
Loading...
$$\rightleftharpoonup{xx}$$
$$\longleftharp{xx}$$,
$$\longrightharp{xx}$$,
摘要
Loading...
$$\rightleftharpoonup{xx}$$
$$\longleftharp{xx}$$,
$$\longrightharp{xx}$$,
通过干法提取工艺获得鹰嘴豆蛋白浓缩物(CPC),并系统表征其组成、功能及结构特性,以评估其在纳米乳液(NE)应用中的适用性。干法提取的CPC蛋白含量为44.8%,表现出优异的 功能性能,包括61.1%的起泡能力和94.7%的高泡沫稳定性,反映出高效的界面吸附能力与内聚膜形成能力。使用3.0% w/v CPC作为乳化剂制备的NE体系,显著降低了液滴粒径,Z-平均粒径为152.7 nm,多分散系数为0.30,表明液滴尺寸分布细小且相对均匀,具有动力学稳定的胶体特性。对鹰嘴豆粉(CF)和CPC进行的差示扫描量热法(DSC)比较分析显示存在两个主要的吸热转变。两种样品均在68.4 °C出现与结合水释放相关的低温吸热峰,但CPC的焓变显著降低,表明干法提取后天然分子有序结构部分遭到破坏。用于NE体系的CPC的X射线衍射(XRD)图谱在2θ范围10°–30°内呈现宽泛的非晶晕,其间夹杂少量低强度的尖锐衍射峰。这些结果证实该浓缩物以非晶结构为主,同时含有部分结晶区域,整体结晶度约为15%。本研究描述了一种可重复、无溶剂的油包水纳米乳液制备方法,采用干法风选分离的CPC作为乳化剂,适用于教学示范及潜在的工业规模放大。
引言
Loading...
$$\rightleftharpoonup{xx}$$
$$\longleftharp{xx}$$,
$$\longrightharp{xx}$$,
豆类来源的蛋白质作为多功能成分,在设计结构稳定的食品乳液方面已受到广泛关注。在这些来源中,鹰嘴豆(鹰嘴豆) 尤为显著,因其全球产量极高(位居第三rd 全球种植最广泛的豆科作物),富含蛋白质(18%–24%),低致敏性,且必需氨基酸组成均衡1,2通常,蛋白质分离物经过额外加工以去除碳水化合物和脂肪,其蛋白质浓度较高(80%–90%);而浓缩乳清蛋白(CPC,蛋白质含量50%–75%)则保留了膳食纤维及其他必需营养素。3这些营养和农艺优势凸显了鹰嘴豆蛋白作为传统植物性和动物性蛋白乳化剂的一种可行替代品。尽管传统低分子量表面活性剂被广泛使用,但其稳定的乳液在储存期间往往仍存在热力学不稳定的问题,容易发生聚结、絮凝和相分离。1相比之下,纳米乳液(NEs)通常具有低于200 nm的液滴直径,表现出更高的动力学稳定性、对包封生物活性成分的更好保护作用,以及在水相体系中更强的分散性。因此,纳米乳液技术已成为开发功能性食品的一种有效策略,可实现疏水性成分的可控释放并提高其生物利用度4.
最近一项研究报道,鹰嘴豆蛋白(CPC) 在乳液形成方面表现出优异的界面和功能特性,包括较强的持水能力、显著的起泡性能以及稳定油水界面的能力。由于其乳化稳定性和清洁标签特性,CPC 还被评估为蛋黄在蛋黄酱型乳液中的潜在替代品1。除这些模型体系外,基于鹰嘴豆蛋白的纳米乳化剂在多种食品基质中也具有应用潜力,包括饮料(浑浊饮料、蛋白水、抗氧化饮料以及姜黄素、ω-3 多不饱和脂肪酸、类胡萝卜素和精油的纳米包埋)、植物基乳制品类似物、减脂配方以及烘焙或糖果馅料4。
尽管鹰嘴豆蛋白(CP)的乳化功能已有广泛报道5,但通过干法提取途径获得的纳米乳化体系却相对受到较少关注,尤其是在食品应用中的可重复性、结构完整性和可扩展性方面。与需要大量调节pH、离心和溶剂去除的传统湿法提取工艺不同,气流分选技术可在常温条件下实现快速的蛋白质富集,且无需使用水、化学品或过度的热处理3。因此,干法提取相较于湿法提取具有显著优势,能够在保持蛋白质功能的同时,降低环境负担和加工复杂性3,6。
然而,当前食品胶体研究中的一个关键未满足需求是,对干法提取如何改变蛋白质结构和热行为,以及这些变化如何影响纳米乳化性能和胶体稳定性的清晰机制性理解。特别是,需要系统评估涉及分子结构、界面活性和起泡行为的结构-功能关系,以推动基于CPC的食品胶体系统的应用7。
本研究的创新之处在于,展示了利用干法空气分级分离的酪蛋白酸钠(CPC)作为一种可重复、无溶剂的纳米乳化剂的应用,并将其组分富集程度与结构、热学及界面功能特性直接关联。因此,本研究旨在通过系统地将干法空气分级获得的CPC的组分富集与其结构、热学和界面性质相联系,证明其可作为有效的纳米乳化剂。研究特别强调对理化特性、起泡能力与稳定性以及X射线衍射(XRD)的分析,以阐明调控纳米乳液(NE)形成与稳定性的结构-功能关系。
访问受限。请登录或开始试用以查看此内容。
方案
Loading...
$$\rightleftharpoonup{xx}$$
$$\longleftharp{xx}$$,
$$\longrightharp{xx}$$,
Sample preparation
Protein separation from chickpea flour (CF)
Kabuli chickpeas (Cicer arietinum L.), harvested during the 2025 growing season and sourced from southeastern Türkiye, were processed using an impact-based air classifier milling system, in which particles were subjected to centrifugal forces and repeated impacts against the grinding disc and ring gear. Following an initial pre-milling step, coarse grits were further milled to produce CF using an air classifier mill. During impact milling, an airflow rate of 40-45 m3/h, a classifier speed of 7,000-8,000 rpm, and a feed rate of 200 kg/h were applied, in accordance with previously reported operating conditions and an in-house optimization protocol, as described in the literature8.
Protein-rich fine fractions were subsequently obtained from CF by air classification at ambient temperature, using the same air classifier system. The classifier wheel speed was set to 10,000 rpm, while the feed rate was maintained at approximately 200 kg/h and the airflow at 52 m³/h, as previously described8. This separation step selectively enriched the protein fraction based on differences in particle size, density, and aerodynamic properties.
Following air classification, the resulting powder exhibited a fine particle size distribution (d(0.9) = 20-22 µm); therefore, no sieving step was applied to avoid material loss and unnecessary mechanical stress. The protein-enriched fraction was directly packaged in 25 kg gas-flushed polyethylene bags and stored at 4 °C to minimize moisture uptake and preserve functional properties until further processing.
Nanoemulsion preparation
CPC was used as the sole emulsifying agent to prepare oil-in-water (O/W) NEs targeting an active protein concentration of 3.0% w/v in the final formulation. This concentration was selected based on preliminary screenings of 1.0% w/v, 2.0% w/v, and 3.0% w/v CPC, which indicated that 3.0% provided the most effective droplet size reduction and the highest short-term physical stability. Based on the measured protein content of the CPC powder (44.8% w/w), the required powder concentration was calculated to be 6.67% w/v. CPC functioned as the emulsifier in the continuous aqueous phase, while medium-chain triglyceride (MCT) oil was used exclusively as the dispersed oil phase at a fixed concentration of 5.0% v/v, corresponding to 5.0 mL oil per 100 mL formulation. No low-molecular-weight surfactants were used in any formulations9.
The aqueous CPC dispersion was prepared by dissolving the calculated amount of CPC powder in ultrapure water under continuous magnetic stirring at 800 rpm for 1,800 s to ensure complete hydration and homogeneous protein dispersion. Complete hydration was confirmed by the absence of visible particles or sediment.
The oil phase was then slowly added to the hydrated CPC solution under continuous stirring, followed by high-shear homogenization at 12,000 rpm for 240 s, producing a coarse (conventional) emulsion, visually identified by a uniform, opaque appearance without visible oil separation. These conditions were selected to avoid protein aggregation while ensuring sufficient droplet disruption.
NEs were subsequently obtained by probe sonication of the coarse emulsion at 30% amplitude for 180 s, performed in an ice-water bath to maintain the sample temperature below 30 °C and prevent protein aggregation. Temperature was monitored intermittently during sonication. Preliminary optimization experiments (data not shown) evaluated sonication times of 60 s, 120 s, and 180 s, and 180 s was selected as the optimal condition based on reproducible formation of NEs with droplet diameters below 200 nm and low PDI. Therefore, all NEs reported in this study were prepared using the optimized sonication time of 180 s.
Successful NE formation was supported by the appearance of a stable, slightly opalescent dispersion with no phase separation after 1,800 s of standing. Samples exhibiting visible creaming or phase separation were excluded from further analysis. All samples were equilibrated to room temperature (25 ± 2 °C) prior to physicochemical characterization9.
CAUTION: Handling of high-energy equipment (homogenizer and sonicator) was conducted in accordance with institutional laboratory safety procedures. Hearing protection and splash shielding were used during sonication. No acids or bases were used during emulsion preparation; therefore, no chemical neutralization or hazardous waste disposal steps were required.
Nutritional and physicochemical characterization of chickpea flour (CF) and chickpea protein concentrate (CPC)
Compositional Analysis
The nutritional composition of CF and CPC samples was determined using Official Methods of Analysis of the Association of Official Analytical Chemists (AOAC). Crude fiber was analyzed according to AOAC 991.43, total ash according to AOAC 923.03, crude fat according to AOAC 920.39, and crude protein according to AOAC 984.13, using a nitrogen-to-protein conversion factor of N × 6.25. The total carbohydrate content of all samples was determined by difference by subtracting the sum of moisture, protein, fat, and ash percentages from 100%3.
Color analysis
The color parameters of the samples were measured using a bench-top colorimeter operating in reflectance mode. Prior to measurement, the instrument was standardized using the black and white calibration standards supplied by the manufacturer. To ensure uniform and reproducible measurements, 5.0 g of powdered sample was gently loaded into a round glass cuvette (64.0 mm internal diameter) to create a smooth, homogeneous surface. A sufficient layer thickness (≥ 50.0 mm) was applied to minimize the influence of substrate and background effects and to render the translucent powder effectively opaque under reflectance conditions. All measurements were conducted in reflectance mode at room temperature.
Color coordinates were expressed in the CIELAB color space, where L* represents lightness (0 = black, 100 = white), a* represents the red-green axis, and b* represents the yellow-blue axis. Additional color parameters, including total color difference (ΔE*), chroma (C*), hue angle (H°), and color index (CI), were calculated according to the equations described in11 (Eqs. 1–4) as follows:
 (Eq. 1)
 (Eq. 2)
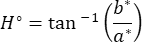 (Eq. 3)
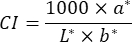 (Eq. 4)
pH analysis
The pH of the CF and CPC samples was determined using a digital pH meter equipped with a glass electrode by inserting the electrode directly into the sample dispersion at 25.0 ± 2.0 °C. Prior to measurement, the pH meter was calibrated using standard buffer solutions (pH 4.0 and 7.0). All measurements were conducted in triplicate (n = 3) to ensure analytical reproducibility.
Moisture content
The residual moisture content of the CF and CPC samples was determined using a rapid moisture analyzer operated under controlled heating conditions. All measurements were performed in triplicate (n = 3) to ensure analytical reproducibility.
Structural and functional characterization of CPC
XRD analysis
XRD analysis of CPC was performed using a laboratory X-ray diffractometer equipped with Cu-Kα radiation (λ = 1.5406 Å). Diffractograms were recorded over a 2θ range of 10°-90° at a scanning rate of 2.5° min-1, operating at 40 mA and 45 kV, following a previously reported procedure12.
Peak identification, background subtraction, and curve fitting were carried out using standard XRD analysis software. The degree of crystallinity was calculated as the ratio of the integrated area of the crystalline reflections to the total area under the diffractogram, according to the method described by13, as shown in Eq. (5):
 (Eq. 5)
The apparent crystallite size (D) was estimated from the XRD data using the Scherrer equation (Eq. 6), applied to the most intense diffraction peaks:
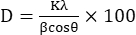 (Eq. 6)
where D is the apparent crystallite size (nm), K is the shape factor (assumed to be 0.9), λ is the X-ray wavelength, β is the full width at half maximum (FWHM, in radians) of the selected diffraction peak, and θ is the Bragg angle.
Differential scanning calorimetry (DSC) analysis
Differential scanning calorimetry (DSC) analysis of CF and CPC was performed using a laboratory differential scanning calorimeter. Approximately 10.0 ± 0.1 mg of sample was accurately weighed and sealed in a concave aluminum crucible with a pierced lid, while an empty aluminum crucible was used as the reference. Measurements were conducted under a nitrogen atmosphere (20 mL/min) to minimize oxidative effects. Samples were heated from 0 °C to 400 °C at a constant heating rate of 5 °C min-1 under dynamic scanning conditions. Temperature and sensitivity calibrations were performed prior to analysis to ensure measurement accuracy and reproducibility.
Thermal transitions were characterized by determining the onset temperature (To), peak temperature (Tp), endset temperature (Te), and the enthalpy change (ΔH) associated with each transition. In addition, the endothermic peak width (EPW) and peak height index (PHI) were calculated according to Eqs. (7) and (8), respectively:
EPW= (Te−Tp) (Eq. 7)
PHI =ΔH/(Tp− To) (Eq. 8)
Foaming capacity (FC) and stability (FS)
The foaming capacity (FC) and foam stability (FS) of a CPC aqueous dispersion (3.0 g/L) were evaluated at pH 7.0, adjusted as needed using 0.1 N hydrochloric acid (HCl). A 30 mL aliquot of protein dispersion were transferred into 50 mL polypropylene centrifuge tubes and homogenized using a high-speed homogenizer operated at 11,000 rpm for 120 s to generate foam. Foam formation was visually confirmed by the rapid increase in sample volume and the formation of a stable foam layer immediately after homogenization.
FC was calculated as the percentage increase in volume immediately after homogenization, while FS was determined based on the retained foam volume after 600 s, 1,800 s, 3,600 s, and 7,200 s. All measurements were performed in triplicate (n = 3), and the FC and FS values were calculated according to Eqs. (9) and Eqs. (10), respectively14:
 (Eq. 9)
 (Eq. 10)
CAUTION: Dilute hydrochloric acid was handled using appropriate laboratory safety precautions, including gloves and eye protection. Waste solutions were disposed of according to institutional chemical safety guidelines.
Physicochemical stability of CPC and CPC-based NEs
Average particle size and particle size distribution
Particle size distribution and Z-average hydrodynamic diameter of the samples were determined using dynamic light scattering (DLS). The Z-average hydrodynamic diameter and the polydispersity index (PDI) were recorded to characterize the mean droplet size and the uniformity of the size distribution, respectively15,16.
Prior to measurement, samples were diluted with distilled water at a ratio of 1:100 (v/v) to minimize multiple scattering effects and ensure reliable light scattering measurements. Analyses were conducted at a controlled temperature of 25 ± 2 °C. The PDI was used as an indicator of droplet size distribution homogeneity, with lower PDI values corresponding to narrower size distributions. Measurements were performed on day 0 (freshly prepared NEs) and after 7 days of storage to evaluate the short-term physical stability of the NE system16. Samples exhibiting visible creaming, sedimentation, or phase separation prior to measurement were excluded from DLS analysis.
ζ-potential of particles
The ζ-potential of the samples was determined to assess the net surface charge and electrostatic stability of the droplets using electrophoretic light scattering (ELS), following previously described methodologies15,16. Measurements were conducted at a controlled temperature of 25.0 ± 2 °C, and undiluted samples were used to preserve the original ionic environment of the NEs.
The mean ζ-potential values and corresponding standard deviations were calculated for each sample to evaluate electrostatic interactions and colloidal stability of the emulsions. All measurements were performed using water as the dispersant, in accordance with an established
internal standard operating procedure15. Samples showing visible phase separation or creaming prior to analysis were excluded from ζ-potential measurements.
Method validation and expected outcomes
Method validation was achieved by evaluating key physicochemical parameters, including Z-average hydrodynamic diameter, PDI, ζ-potential, and physical stability under stress. Successful protocol execution was supported by the reproducible formation of NEs with droplet sizes below 200 nm and PDI ≤0.30. To further validate stability beyond simple storage, a centrifugation stress test at 4,000 rpm for 900 s was performed. The absence of visible phase separation or creaming after centrifugation, coupled with consistent ζ-potential and pH profiles over 7 days of storage, collectively supports the robust emulsifying capacity of CPC and the reproducibility of the proposed protocol.
Statistical analysis
Compositional and functional measurements were conducted in triplicate (n=3), while structural analyses (XRD and DSC) were performed as single measurements, representative runs. The results are presented as the mean value ± standard deviation (SD). Statistical evaluations were performed using one-way analysis of variance (ANOVA) via in SPSS software. For all analyses, a p-value of < 0.05 was considered to indicate statistical significance. In cases where significant differences were identified, Tukey's Honestly Significant Difference (HSD) post-hoc test was employed for multiple comparisons. Statistical connecting letters (e.g., a, b, c) presented in the tables and figures were derived from the results of the Tukey HSD test; means sharing the same letter are not significantly different at the 5% significance level.
访问受限。请登录或开始试用以查看此内容。
结果
Loading...
$$\rightleftharpoonup{xx}$$
$$\longleftharp{xx}$$,
$$\longrightharp{xx}$$,
CF 和 CPC 的营养与理化特性表征
组成参数
CF 和 CPC 的组成参数总结于表 1中。CPC 含有 44.8% 的蛋白质、5.8% 的粗脂肪和 45.9% 的总碳水化合物,表明经过干法分级处理后,其蛋白质含量相对于 CF 显著提高。CPC 中蛋白质含量的增加证实了气流分选在富集蛋白质组分方面的有效性。本研究获得的蛋白质水平处于文献报道的 CPC 蛋白质含量范围(40%–55%)之内,表明所制备的 CPC 在组成上与先前报道的 CPC 材料具有可比性。
除了其成分上的优势外,CPC还表现出重要的技术功能特性,包括溶解性、持水能力、持油能力以及界面活性。这些特性对于分散体系的形成与稳定具有重要的功能意义。基于这些特性,CPC能够形成粒径小于200 nm的纳米乳液(表5),证明其作为植物来源乳化成分的有效性能。
颜色分析
经过气流分级后,CF 和 CP...
访问受限。请登录或开始试用以查看此内容。
讨论
Loading...
$$\rightleftharpoonup{xx}$$
$$\longleftharp{xx}$$,
$$\longrightharp{xx}$$,
本研究通过气流分级法获得浓缩豌豆蛋白(CPC),并对其组成、功能、结构和胶体特性进行了表征,特别关注其作为植物源性纳米乳化剂的应用。与冷榨粉(CF)相比,气流分级等非热加工方法可显著提高蛋白质含量,所得CPC的蛋白质含量达44.8%3。相较于文献中主要通过湿法提取制备的CPC,本研究拓展了现有认知,证明了在特定加工条件下,采用干燥的气流分级工艺可获得富含蛋白质的组分,该组分能够支持纳米乳液(NE)的形成并维持短期的理化稳定性。这与以往研究形成对比,后者通常依赖pH调节、溶剂/化学试剂添加以及复杂的水相处理步骤来制备用于乳化应用的蛋白质分离物17,18,19。本研究结合组成分析、界面功能特性(起泡性)以及胶体表征(Z均粒径、多分散系数PDI、ζ-电位及25 °C下储存7天),提供了一套综合数据集,将干法分级的结果与纳米乳液性能关联起来。因此,本研究提出,干法气流分级是一种无需溶剂且能保持功能特性的方法,可用...
访问受限。请登录或开始试用以查看此内容。
披露
Loading...
$$\rightleftharpoonup{xx}$$
$$\longleftharp{xx}$$,
$$\longrightharp{xx}$$,
作者声明,在本文件所报告的工作中,不存在已知的可能影响研究的财务利益冲突或个人关系。
致谢
Loading...
$$\rightleftharpoonup{xx}$$
$$\longleftharp{xx}$$,
$$\longrightharp{xx}$$,
作者衷心感谢Bekir Çakıcı先生(SFA Ar-Ge Sağlık Hizmetleri)在纳米乳液配制和ζ电位分析方面提供的技术支持。诚挚感谢Rüya Kandemir女士(Çukurova大学CUMERLAB分析中心)在X射线衍射(XRD)分析中给予的协助。作者还感谢Dervişoğlu Bakliyat A.Ş.公司为本研究中开展的各项分析提供了蛋白质试验样品及实验室设施的使用支持。
访问受限。请登录或开始试用以查看此内容。
材料
| 姓名 | 公司 | 目录编号 | 评论 |
|---|---|---|---|
| 50 mL 锥形管 | Corning | 352070 | 聚丙烯离心管 |
| 气流分级磨 |  | CSM1250 | 用于蛋白质分级的气流分级磨 |
| 分析天平 | Sartorius | BCE224I-IS | 分析天平(最大称量 120 g) |
| 自动移液器 | Brand | 3123000055 | 可调移液器(200 μL、1 mL、5 mL) |
| 离心机 | Eppendorf | 5810R | 制冷离心机 |
| 鹰嘴豆样品 | | — | 食品级鹰嘴豆 |
| 色差仪 | HunterLab | A60-1014-593 | 用于颜色分析的仪器 |
| 差示扫描量热仪 | NETZSCH | — | DSC 分析 |
| 数字温度计 | Hanna Instruments | HI-98501 | 温度监测 |
| 磷酸氢二钾(Na2HPO4) | Sigma-Aldrich | S7907 | 分析纯 |
| 脂肪分析仪 | C. Gerhardt GmbH & Co. KG | 13-0005 | 基于索氏提取法的脂肪分析 |
| 高速均质机 | VELP | SA20900010 | 粗乳液的均质化 |
| 盐酸(HCl) | Sigma-Aldrich | 320331 | 分析纯 |
| 盐酸溶液(0.1 N) | Sigma-Aldrich | H1758 | 调节 pH |
| 凯氏定氮催化剂片 | C. Gerhardt GmbH & Co. KG | 12-0328 | 凯氏定氮分析 |
| 磁力搅拌器 | IKA | 3339000 | 样品混合与水合 |
| 中链甘油三酯油 | Ataman Kimya A. | https://www.atamanchemicals.com /medium-chain-triglycerides-mct _u30009/?lang=TR#:~:text =Orta%20zincirli%20trigliseritler %20(MCT)%2C%20hindistance vizi%20ve%20hurma%20%C3 %A7ekirde%C4%9Fi%20ya%C 4%9Flar%C4%B1nda,g%C3%B Cne%C5%9F%20kremleri%20i% C3%A7in%20%C4%B1slat%C4% B1c%C4%B1%20ajand%C4%B1r. | 食品和药用级油 |
| 水分分析仪 | Mettler Toledo | HC103 | 水分测定 |
| 粒径与Zeta电位分析仪 | Malvern Instruments | ZEN3600 | 动态光散射与电泳迁移率 |
| pH计 | Mettler Toledo | MET-30671567 | pH测量 |
| 塑料离心管 | ISOLAB | 078.02.003 | 一次性塑料管 |
| 猪胃蛋白酶 | Sigma-Aldrich | P7012 | 酶(1:10,000) |
| 磷酸二氢钾(KH2PO4) | Sigma-Aldrich | P5379 | 分析纯 |
| 探头式超声波破碎仪 | Bandelin | — | 乳液超声处理 |
| 防护眼镜 | Baymax | BX-2500 | 实验室安全设备 |
| 蛋白质分析仪 | C. Gerhardt GmbH & Co. KG | 12-0520 | 蛋白质测定 |
| 蛋白质消化系统 | C. Gerhardt GmbH & Co. KG | 12-0700 | 凯氏消化装置 |
| 氯化钠(NaCl) | Sigma-Aldrich | S9625 | 分析纯 |
| 氢氧化钠(NaOH) | Sigma-Aldrich | S5881 | 分析纯 |
| 刮勺 | — | https://www.blabmarket.com/ meta-etiket/plastik-spatul?srsltid =AfmBOoqsvXR_3rQgU1n8QBn DyR_P9D52v2Hahy27RLOH7Zg VbFzzcbsb | 塑料刮勺 |
| 超纯水系统 | ELGA Labwater | PC110COBPM1 | 水电阻率 18.2 MΩ·cm |
| 容量瓶 | Schott Duran | 2120117 | 100 mL 容量瓶 |
| 水浴锅 | Memmert | WTB24 | 温度控制(20–25 °C) |
| X射线衍射仪(Cu–Kα) | PANalytical | STEM-LE-0294-LC | XRD 分析(45 kV,40 mA) |
参考文献
Loading...
$$\rightleftharpoonup{xx}$$
$$\longleftharp{xx}$$,
$$\longrightharp{xx}$$,
- Bi, C., Qie, A., Liu, Y., Gao, F., Zhou, T. Chickpea protein stabilized Pickering emulsions : As a novel mayonnaise substitute. J Food Eng. 382, 112180(2024).
- Zhang, Y., Huang, X., Zeng, X., Li, L., Jiang, Y. Preparation, functional properties, and nutritional evaluation of chickpea protein concentrate. Cereal Chem. 100 (2), 310-320 (2023).
- Yeasmen, N., Orsat, V. Industrial processing of chickpeas (Cicer arietinum) for protein production. Crop Sci. 65, 1-24 (2025).
- Kaptan, B. Use of Nanoemulsion Technology in Dairy Industry. Food Sci Nutr. 12 (s2), 2415-2428 (2024).
- Boye, J., Zare, F., Pletch, A. Pulse proteins: Processing, characterization, functional properties and applications in food and feed. Food Res Int. 43 (2), 414-431 (2010).
- Pelgrom, P. J. M., Berghout, J. A. M., van der Goot, A. J., Boom, R. M., Schutyser, M. A. I. Preparation of functional lupine protein fractions by dry separation. LWT Food Sci Tech. 59 (2-1), 680-688 (2014).
- Stone, A. K., Karalash, A., Tyler, R. T., Warkentin, T. D., Nickerson, M. T. Functional attributes of pea protein isolates prepared using different extraction methods and cultivars. Food Res Int. 76 (Part 1), 31-38 (2015).
- Xing, Q., et al. A two-step air classification and electrostatic separation process for protein enrichment of starch-containing legumes. Innov Food Sci Emerg Technol. 66, 102480(2020).
- Kurt, A. A., Ibrahim, B., Çınar, H. Nanoemulsion Hydrogel Delivery System of Hypericum perforatum L.: In Silico Design, In Vitro Antimicrobial - Toxicological Profiling , and In Vivo Wound-Healing Evaluation. Gels. 11 (6), 431(2025).
- Ayseli, M. T., et al. Physicochemical, rheological, molecular, thermal and sensory evaluation of newly developed complementary infant (6-24 months old) foods prepared with quinoa (Chenopodium quinoa Willd.) flour. Food Chem. 315, 126208(2020).
- Balcázar-Zumaeta, C. R., et al. Optimizing roasting time and temperature to enhance the physicochemical properties, and retention of bioactive compounds of three coffee arabica subvarieties. Appl Food Res. 5 (1), 100987(2025).
- Tao, J., et al. Physicochemical properties and functional characterization of buckwheat type 3 resistant starch prepared by various treatment methods. LWT Food Sci Tech. 218, 117467(2025).
- Purohit, S. R., Rao, P. S. Modelling and Analysis of Moisture Sorption Isotherm of Raw and Pregelatinized Rice Flour and Its Crystalline Status Prediction. Food Anal Methods. 10, 1914-1921 (2017).
- Ghribi, A. M., et al. Effect of drying methods on physico-chemical and functional properties of chickpea protein concentrates. J Food Eng. 165, 179-188 (2015).
- Vardar, K., et al. Efficiency of Calcium Fructoborate-Loaded Novel Natural Niosomes Compared to Traditional Liposomes and Niosomes in Rat Ischemia - Reperfusion Injury Model. Pharmaceutic. 17 (11), 1434(2025).
- Awlqadr, F. H., et al. Encapsulation of lutein in nanoemulsions: Comparative evaluation of chickpea and soy protein isolates on physicochemical stability, antioxidant activity, and rheological properties. Food Chem X. 28, 102623(2025).
- De Angelis, D., Latrofa, V., Squeo, G., Pasqualone, A., Summo, C. Techno-functional, rheological, and chemical properties of plant-based protein ingredients obtained with dry fractionation and wet extraction. Curr Res Food Sci. 9, 100906(2024).
- Tabtabaei, S., Kuspangaliyeva, B., Legge, R. L., Rajabzadeh, A. R. Air Classification of Plant Proteins. Green Prot Process Technol Plants Novel Extract Purificat Meth Prod Dev. , (2023).
- Sohaimy, S. A. E., Brennan, M. A., Darwish, A. M. G., Brennan, C. S. Chickpea Protein Isolation, Characterization and Application in Muffin Enrichment. Int J Food Stud. 10, 57-71 (2021).
- Sánchez-Vioque, R., Clemente, A., Vioque, J., Bautista, J., Millán, F. Protein isolates from chickpea (Cicer arietinum L.): Chemical composition, functional properties and protein characterization. Food Chem. 64 (2), 237-243 (1999).
- Ladjal-Ettoumi, Y., Boudries, H., Chibane, M., Romero, A. Pea, Chickpea and Lentil Protein Isolates: Physicochemical Characterization and Emulsifying Properties. Food Biophys. 11, 43-51 (2016).
- Yeasmen, N., Orsat, V. Pulsed ultrasound assisted extraction of alternative plant protein from sugar maple leaves: Characterization of physical, structural, thermal, electrical, and techno-functional properties. Food Hydrocoll. 152, 109960(2024).
- Xiao, S., Li, Z., Zhou, K., Fu, Y. Chemical composition of kabuli and desi chickpea (Cicer arietinum L.) cultivars grown in Xinjiang, China. Food Sci Nutr. 11 (1), 236-248 (2023).
- Sozer, N., Holopainen-Mantila, U., Poutanen, K. Traditional and new food uses of pulses. Cereal Chem. 94 (1), 66-73 (2017).
- Xiao, K., et al. Artificial intelligence-assisted optimization of extraction process, characterization, and functional analysis of globulin from safflower seed meal. Front Nutr. 12, 1708593(2025).
- Akter, F., et al. Development of protein-rich biscuit utilising lablab bean seed: a sustainable management of underutilised plant protein in Bangladesh. Int J Food Sci Technol. 59 (1), 545-551 (2024).
- McClements, D. J. Food Emulsions: Principles, Practices, and Techniques. , Third Edition, (2015).
- Sun, Y., et al. Changes in crystal structure of chickpea starch samples during processing treatments: An X-ray diffraction and starch moisture analysis study. Carbohydr Polym. 121, 169-174 (2015).
- Vogelsang-o'Dwyer, M., et al. Comparison of Faba Bean Protein Ingredients Environmental Performance. Foods. 9, 322(2020).
- Sun, Y., et al. A new method for determining the relative crystallinity of chickpea starch by Fourier-transform infrared spectroscopy. Carbohydr Polym. 108, 153-158 (2014).
- Schutyser, M. A. I., Pelgrom, P. J. M., van der Goot, A. J., Boom, R. M. Dry fractionation for sustainable production of functional legume protein concentrates. Trends Food Sci Technol. 45 (2), 327-335 (2015).
- Onder, S., et al. Exploring the Amino-Acid Composition Secondary Structure, and Physicochemical and Functional Properties of Chickpea Protein Isolates. ACS Omega. , (2022).
- Arshad, P. M., Sharma, N., Sharma, M. Extraction and characterization of chickpea protein isolate and its application in the development of a plant-based frozen dessert. Sustain Food Technol. , (2025).
- Moussaoui, D., Chaya, C., Badia-Olmos, C., Rizo, A., Tarrega, A. Effect of pH and Calcium on the Techno Functional Properties of Different Pulse Flours, Pastes, and Gels. Food Bioprocess Technol. 17, 2292-2303 (2024).
- Lam, A. C. Y., Can Karaca, A., Tyler, R. T., Nickerson, M. T. Pea protein isolates: Structure, extraction, and functionality. Food Rev Int. 34 (2), 126-147 (2018).
- Calligaris, S., et al. Nanoemulsion preparation by combining high pressure homogenization and high power ultrasound at low energy densities. Food Res Int. 83, 25-30 (2016).
- Damodaran, S. Protein stabilization of emulsions and foams. J Food Sci. 70 (3), R54-R66 (2005).
- Cui, B., et al. Ultrasound-mediated fabrication of chickpea protein nanoparticles for stabilizing Pickering emulsions. Ultrason Sonochem. 121, 107574(2025).
- Lai, X. J., et al. Enhancement of extraction efficiency and functional properties of chickpea protein isolate using pulsed electric field combined with ultrasound treatment. Ultrason Sonochem. 111, 107089(2024).
访问受限。请登录或开始试用以查看此内容。
重印与许可
申请许可以重复使用本 JoVE 文章的文本或图表
申请许可