$$\rightleftharpoonup{xx}$$
$$\longleftharp{xx}$$,
$$\longrightharp{xx}$$,
All the software and tools used in the study are listed in the Table of Materials.
Grading criteria
The classification of evaluation adopted in the present study addresses two major domains, namely, fluency and correctness, which incorporate all the requirements for comprehensive evaluation of writing in English as a Foreign Language (EFL). These dimensions are intended to measure the key points of the writing quality that help in effective communication and demonstration of skill in language proficiency. The Fluency module measures naturalness, expressiveness, and coherence in writing by measuring the smoothness of ideas as well as how well words and sentence structure are used. The Correctness module targets precise grammatical accuracy, mechanical flawlessness, and compliance with standard English conventions and, hypothetically, measures and counts the language's erroneousness on several levels. (see Table 1)
Task definition
Following the conditions of automated writing assessment of students learning the English language, the present study suggests a new model of an EG computer-assisted English writing evaluation system. Compared to the previous studies, which have been limited by the scope of automated writing evaluation systems, the proposed system will help resolve those limitations through the introduction of innovative deep learning techniques to allow users a level of linguistic analysis, scope of modification, and system-wide feedback analysis based on the extensive processing of data. Operating on two of the most significant indicators of a composition, namely, fluency (how natural, coherent, and expressive in nature is the piece), or correctness (how correctly written the text, riddled with grammatical, mechanical and language errors is), with the separate components of the neural networks, the dual-model system has to perform a number of evaluations. Besides, it identifies mistakes on several linguistic levels, recommends correctional measures, and gives feedback in a list form to enable users to improve students’ language learning in a methodical way. In order to describe the process of calculating the computer-assisted automatic evaluation system, we suggest the following mathematical model in formulas (1)–(4) (see Table 2).
 (1)
(1)
 (2)
(2)
 (3)
(3)
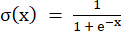 (4)
(4)
where: Final Score = the composite writing evaluation score; w1 = weight assigned to fluency score; w2 = weight assigned to correctness score; Sf = BERT-based fluency score (normalized to [0, 1]); Sc = exponential decay correctness score; λ = decay constant controlling error penalty; σ(x) = logistic sigmoid activation function; ErrorRatio = ratio of errors to total tokens in the text. The fluency scores are normalized to [0, 1] by the logistic sigmoid function σ(x) whereas the exponential decay function is used in scoring the correctness to impose an appropriate penalty on error frequency.
System architecture and design
Its system architecture uses a two-model system with a parallel processing architecture, in which the analysis of input essays is performed in parallel via parallel evaluation pathways. The Fluency and Correctness modules, in turn, yield respective scores, and the final composite score is the weighted average of the two sub-scores. The correctness module also offers a suggestion on error detection and correction, besides scoring (see Figure 1).
The fluency module
Writing fluency can be defined as the nature or pattern of the use of a language with regard to correct choice of vocabulary, sentence structure variety, syntactic complexity, coherence, etc.4. Fluency assessment models capture ideas being conveyed without stuttering or being awkward, sounding approximate to the nativist type of communication trends. Traditional fluency measurement is based on scales, highlighting inter-rater reliability concerns. The proposed system overcomes this drawback as it includes BERT based neural network to induce semantic coherence and linguistic naturalness automatically through deep situational understanding. This architectural decision was made considering the strengths of BERT, which has been found to be effective regarding the identification of contextual relationships and semantic patterns that are necessary in fluency measurement. Input sequences are fed into the system and passed through 12 transformer layers with multi-head self-attention to identify long-range dependencies and contextual relationships (see Figure 2).
The mechanism of attention would be as follows:
 (5)
(5)
Let Q, K, and V be the matrices that represent query, key, and value, respectively, and d and k be the dimensions of the key vectors. The CLS token embedding is the summary one, which records the overall semantic coherence of the whole input sequence.
The calculation of the fluency score is as follows:
 (6)
(6)
In which hCLS is the BERT [CLS] token embedding, and Wreg, are breg the parameters of the regression head, and σ is the sigmoid activation function that normalizes the output to [0, 1].
The correctness module
Correctness assessment focuses on grammatical accuracy, mechanical exactness, and adherence to standard English conventions. This dimension addresses the technical aspects of writing, including syntax, morphology, punctuation, and spelling accuracy. The correctness component not only evaluates the number of linguistic errors but also examines the impact on the overall quality of the text. Unlike fluency assessment, which emphasizes semantic coherence and natural flow, the correctness evaluation module requires precise error identification and systematic correction. The module distinguishes between different error types, assesses the severity, and provides targeted corrections to support learning improvement. The correctness loss uses the FLAN-T5 model, which has been fine-tuned for grammatical error spotting and correction. This choice is informed by the text-to-text transformability of T5 that allows the system to not only fault find but also render relevant corrections within one system. The system is an encoder-decoder form, and the text is fed in the form of this transformation: (see Figure 3)
 (7)
(7)
The encoder element generates context-sensitive representations that not only capture the grammatical tendencies but also potential areas of failure:
 (8)
(8)
With the help of generating appropriate grammatical variations to falsely identified mistakes, the decoder generates corrected sequences:
 (9)
(9)
This kind of two-way processing enables the system to have the awareness of the contexts of errors, and how the contexts should be rectified, so the hints are semantically coherent, yet focus on any correction in grammar.
Quantification of error and scoring algorithm
The score of accuracy compared the original writing to the correct version of writing, considering the linguistic errors and the severity based on the position within the text and the interference with the meaning. This method captures the distinction between types of errors in comparison to the impact on the textual understanding of the text. The relationship between frequency of errors and poor quality of text was stressed in a logarithmic manner in the grading system. A fundamental step in token comparison of the original text and corrected text is two degrees of comparison that are founded on the bit-wise technique of string alignment. The second stage involves the identification and classification of types of errors based on some known linguistic taxonomies that differentiate between grammatical errors (subject-verb agreement, tense consistency, and syntactic structure reliability), mechanical (capitalization, punctuation, and spelling), and usage (word choice, idiomatic expression, and register appropriateness) errors. The third stage is the calculation of the error ratio based on the total length of the text. The fourth step exploits the exponential decay scoring algorithm that transforms the ratios of errors into directly interpretable correctness scores to approximate the non- additive and non- linear dependence between frequency of mistakes and text quality.
The mathematical treatment of the error quantification process begins with the calculation of the ratio of errors installed, which provides a normalized error installation rate, which in turn permits a fair comparison to be made of texts of different lengths:
 (10)
(10)
 (11)
(11)
It was established calibration parameter of 2.5 on an empirical basis by fully validating this with human expert judgments, so that the scoring function can offer results in line with human understanding in relation to the decrease in text quality as the frequency of errors increases. Setting this parameter value in this way ensures that any text with a low error rate (Error_Ratio < 0.1) has a high score of correctness as it closely follows the rules of standard English, any text with a moderate error rate (0.1 < Error_Ratio ≤ 0.3) has an intermediate score of correctness indicating that there are some linguistic concerns which are nonetheless not outright disastrous, and any text with a high error rate (Error_Ratio > 0.3) has gotten a low score of correctness because there are critical linguistic concerns which significantly affect the possibility of comprehension.
The correctness scoring algorithm for the correctness evaluation systematically takes into account all errors located and fixed by the T5-based system as penalty items in the calculation of the final error ratio. The penalty credit mechanism used for grammatical errors is represented by the exponential decrease of the with error proportion growth towards high values, which means that the quality of the text is very poor, and becomes 100 when the error ratio equals 0, which means there are absolutely no errors detected. It is a perfect usage of English standard conventions. Such a mathematical relation ensures that the code of correctness offers significant distinction within the whole spectrum of linguistic proficiency levels and is responsive to small successive advances, which indicate real acquisitions.
Datasets: training and evaluation corpus
Training data of sufficient quality and scope is paramount to the performance of the dual-model system. The current study utilized a well-designed dataset of student-written texts to develop and assess the model, which was produced by employing different writing tasks. The sample comprised 45 males and 45 female Pakistani university students with an average age of 19 years, studying ‘Functional English’ as a compulsory course. Each student wrote eight essays for eight weeks, including pre-test, intervention essays, and post-test occasions. Students were allowed to produce 400–450 words for each writing task. The statistics of the data sets provide the following characteristics:
70,500 words
Mean sentence length: 15.7 words (SD = 3.2)
The range of vocabulary (Type-Token Ratio): 0.64 (SD 0.08) Grammatical error density: 2.3 in 100 words (SD = 1.1)
The justification and data quality assurance of the selected data
The dataset that was chosen was driven by a few important considerations that allowed for the richness and relevance to research work on automated writing evaluation. To begin with, the Economics student population was selected due to the nature, similar to EFL learners in the Pakistani higher education, thus enabling presentation of more authentic writing samples that reflect real-world situations. Second, the establishment of the maximum and minimum potential word range, 400–450 words, was informed by pilot studies data that this range is linguistically complex enough to be reliably analyzed by a machine, and it remained at the same time of manageable size in terms of consistent human assessments. Each of the compositions was evaluated by three trained English teachers (inter-rater reliability κ = 0.847, fluency dimension, and 0.823, correctness dimension) on standardized 10-point fluency and correctness rating scales. Training of the human evaluators was rigorous and depended on developed scoring rubrics with respect to IELTS and TOEFL writing assessments. The data consists of a human-annotated dataset, which can be used in training and validating models to be trained on human-annotated data.
Procedures of data preprocessing and validation
The dataset was pre-processed systematically and involved text normalization, tokenizing the text with the BERT WordPiece tokenizer, and making quality validation checks. Those who have submitted incomplete work and have produced plagiarized text were not included to determine data integrity. The last data was randomly divided into training (70%, n = 189), validation (15%, n = 41), and test sets (15%, n = 40) through stratified sampling to make it balanced across proficiency levels and the type of tasks. Linguistic analysis of a large reference corpus containing professionally edited academic texts, articles from newspapers, and published essays, making approximately 50 million words. This corpus provides language patterns needed to perform the fluency tests and assists in the procedures of error detection by comparing these with the standard usage. In the reference corpus, the steps before preprocessing and indexing are tokenization, part-of-speech tagging, syntax parsing, and semantic labeling to facilitate efficient access during real-time assessment.
Fluency model training strategy
A sequential optimization system is proposed to train the data to achieve fluency. The training used state-of-the-art features, including adaptive learning rate scheduling, progressive batch size, and advanced regularization methods that prevent overfitting as training proceeds, thereby maintaining the model's effectiveness in identifying linguistic patterns indicative of language fluency. The learning rate is 5 × 10⁻⁴ with a linear decay schedule, configured to ensure convergence remains stable and does not oscillate around the optimal parameter values. This learning rate is chosen through grid search in [1 x 10⁻⁶, 1 x 10⁻⁴] with 5 x 10⁻⁵ being the most appropriate tradeoff between the convergence speed and the stability. The real training will be restricted to only 3 epochs, a configuration that has been optimized on the basis of empirical benefits by the validation loss tracking to prevent overfitting without preventing sufficient parameter updates to render learning effective. Early halting of mechanisms with a patience of 2 epochs and a minimum delta of 0.001 has been done to prevent degradation.
Optimization is carried out by AdamW optimizer, with simplified choices like β₁ = 0.9 (momentum, which controls the decay of first moment estimates exponentially), β₂ = 0.999 (second-moment estimation, which controls the decay of second moment estimates exponentially), and ε = 1 × 10⁻8 (numerical stability term). Weight decay regularization (λ = 0.01) prevents parameter magnitudes from growing excessively large, with this value selected through validation performance analysis across the range [0.001, 0.1]. Complex monitoring is able to monitor various metrics across training to guarantee the best performance of a model and avoid overfitting. Included in the monitoring framework are:
Loss tracking: Training and validation loss are tracked within every epoch, and the early stopping happens automatically when validation loss no longer improves during 2 consecutive epochs.
Performance metrics: The validation data are used in calculating Pearson correlation coefficients between predicted and actual scores every 100 training steps.
Gradient sensing: Gradient norms are monitored to detect vanishing and exploding gradients, and at a gradient norm of 1.0, gradient clipping is applied.
Learning rate scheduling: Validation-based learning rate decrease (factor = 0.5) in case of more than 1 epoch plateau is detected.
Regularization-Related: Dropout rates (0.1 for BERT’s, 0.3 for regression head) were found by systematic ablation. Several regularization methods based on preventing overfitting are used during the training process: (1) dropout regularization using optimized dropout rates per type of layer in the network, (2) weight decay as explained above, (3) early stopping, determined by the validation performance, and (4) data augmentation based on paraphrasing 15 percent of the training examples using back-translation methods. Checkpoints of the best-performing model were saved after every epoch, and the highest-scoring models were selected based on validation correlation scores. The loss function used in the fluency assessment part is the Mean Squared Error (MSE), which is the main objective function of the regression task of predicting the continuous fluency scores. The loss formulation mathematically is given as:
 (12)
(12)
N is the total training sample size, y_pred, i being the predicted fluency score of the i-th sample, and y_true, i being the corresponding ground truth score as was given by human expert evaluators. This loss is very useful in discouraging prediction-actual error quadratically so that bigger errors attract a larger penalty, and is differentiable as well. The learning rate scheduling mechanism is highly advanced with a two-phase process, and it starts with a linear warmup stage, followed by a systematic decay process in order to create optimal convergence features. This is done in the warmup stage, whereby the learning rate starts at zero and gradually changes to the maximum rate, after which the model parameters are optimized relative to the training dataset. The mathematical expression of the warm-up phase is:
 (13)
(13)
After the warmup phase, the learning rate is decayed in a systematic linear manner to avoid overshooting of the optimum parameter values and results in steady convergence. Mathematically, the decay phase reads as:
 (14)
(14)
In which t is the current training step, lr max is the maximum learning rate achieved during the warmup, warmup is the number of steps assigned to the warmup phase, and total is the total number of training steps over all epochs. The mentioned scheduling procedure ensures aggressive learning of the model at the lower levels and stability on the convergence levels.
Correctness model training strategy
The correctness model was based on the transfer learning strategy using the pre-trained FLAN-T5 model to take advantage of all the available grammar knowledge as required. This was meant to look into the general language understanding as well as the specific information regarding the mistakes committed by the ESL learners. The transfer learning method used calls upon the pszemraj/flan-t5-large-grammar-synthesis checkpoint as the base model, with several noteworthy advantages in terms of correctness. As the model is already trained and possesses a high language understanding capacity that has been trained in various fields of text, it will adapt to many writing styles and writing topics. Particularly, grammar-specific fine-tuning has been conducted on large correction datasets spanning multiple types of grammatical errors as would be encountered in second language writing. Moreover, the checkpoint comprises powerful error-detecting systems that are tested against the different types of errors (i.e., morphological errors, syntactic, and semantic errors), creating a perfect standard of comparison to the innate correction testing parameters of the study.
The domain adaptation process reflects the systematic parameter modifications that do not alter the general capabilities of language understanding of the pre-trained model but introduce the specific features of the writing assessment task solution. This process of adaptation has the mathematical derivation as:
 (15)
(15)
Here θpretrained represents the parameters of the pre-trained model encoding general language understanding and grammatical knowledge, and Δθdomain represents the specific parameter updates learned from the target writing assessment task. The domain-specific updates are computed by gradient-based optimization on the target dataset, ensuring the model develops task-specific sensitivity to error types common in EFL writing without disrupting its broader linguistic capabilities.
Experiments with comparisons
To prove the functionality of the EG, the Pearson correlation coefficient is proposed as the key value of measurement, which determines the linear connection between automated scores and the expertise of humans. The correlation coefficient is found by the formula:
 (16)
(16)
Where xi represents the automated scores, represents the human ratings, and  and
and  are the respective means. The correlation coefficient ranges from −1 to 1, with values near 1 indicating a strong positive relationship between automated and human assessment.
 (17)
(17)
 (18)
(18)
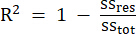 (19)
(19)
Baseline model comparisons
To evaluate the performance of the EG and demonstrate its superiority to existing methods, in-depth comparisons are made with established AWE and traditional single-metric approaches. These baseline comparisons are essential for validating the added value of the EG architecture and demonstrating that the integration of fluency and correctness assessment provides measurable improvements over approaches that focus on individual dimensions in isolation. The selection of baseline models covers four categories of AWE, each reflecting a distinct orientation toward how writing should be assessed. The first one has a single BERT-based model to evaluate fluency. These models use transformer architectures to assess the textual patterns of smoothness and coherence. The second category, embedded in traditional linguistic methodologies, focuses on rule-based systems for grammatical error detection. Hence, the focus remained on correctness, overlooking other aspects related to writing quality, such as cohesion and content. The third category is feature-based AWE systems, which includes indicators of linguistic complexity—like variational sentence length, diversification of lexis, and syntactic complexity to generate overall quality scores. The fourth one takes hybrid systems into account by combining various surface-level linguistic features, often using ensemble methods or weighted averages. These models do not reach the level of integrated sophistication achieved by EG neural architectures. Baseline model performance is evaluated with three major dimensions. The first one measures alignment of system-generated grades with trained human experts’ (English instructors) ratings using standardized rubrics. The second determines generalizability, identifying if performance remains consistent across three essays with varying topics and complexity. The third dimension relies on predictive reliability, assessing the accuracy and stability of scoring through statistical tools such as mean absolute error, root mean square error, and confidence interval analysis. Collectively, these dimensions establish a robust framework for comparison and highlight the superiority of EG systems, particularly in achieving greater precision and stability than traditional approaches.
Experimental and control groups
This study comprised 90 undergraduate Economics students who were studying a functional English course in two intact classes. The data was taken at three occasions: pre-test, intervention, and post-test to track progress in writing accuracy and fluency over time. This human subject study was approved by the Departmental Advisory Board, COMSATS University Islamabad, Lahore Campus, Pakistan. Participants were exposed to two conditions: traditional human feedback and computer-supported feedback. The control group consisted of 45 students, who received the traditional written feedback from a trained English instructor. Participants received written feedback about students’ essays in the form of holistic marks, identification of errors, and recommendations in the shape of comments by an instructor on how to improve the work. The experimental group, in its turn, included 45 students who were instructed the same way in the classroom, yet students’ writing was supplemented with the help of rapid automated feedback provided by the EG, which provided them with the diagnostic information, both in terms of fluency and correctness, within about 30 seconds of the submission.
This study was carried out over a duration of 8 weeks, where a pre-test (Week 1) was carried out to determine the initial writing performance of the test subjects before the students were given an intervention. Computer-based feedback with NLP semantic markers in the experimental group and teachers’ evaluation in the control group were given to the participants for six weeks. Ultimately, the post-test (in Week 8) was carried out to understand the difference between pre- and post-test measures of accuracy and fluency scores. To obtain similar results in comparability, respondents were requested to undertake similar tasks in writing at every assessment period, thereby minimizing potential confounding variables of the task difficulty and familiarity of content in the writing. To ensure that the writing prompts are consistent with the level of difficulty, as well as setting content validity, the writing prompts were chosen in a manner that is congruent. Essay topics were chosen on the basis that the students cover various content areas so as to prevent practice effect and boredom on the part of the participants from having to do a similar task over a long duration of time.
During the pre-test phase, the participants were requested to compose an essay of 400–450 words and write about the academic and career goals. This descriptive assignment was based on personal experience and future projections, which implies the need to organize the writing, provide clear examples, and make a logical statement of personal goals and motivation. The intervention writing task was based on different topics, such as writing about the daily routine of life, hobbies, traveling, the first day at the university, memorable days of life, and best friend moments. The post-test prompt was connected to the subject matter of the ‘Effect of technology on communication,’ and the essay length required was 400–450 words.