The research aims to provide a new approach for teaching assessment calibration and educational equity in intelligent education. Experimental results indicate that the proposed model significantly outperforms comparative models, effectively addressing issues of poor multi-source data integration and fairness bias in existing calibration methods.
Research Article
FairEduNet Algorithm Design and Teaching Assessment Calibration Considering Equity in Higher Education
Opens in a new tab
In This Article
Summary
Loading...
$$\rightleftharpoonup{xx}$$
$$\longleftharp{xx}$$,
$$\longrightharp{xx}$$,
Abstract
Loading...
$$\rightleftharpoonup{xx}$$
$$\longleftharp{xx}$$,
$$\longrightharp{xx}$$,
Current teaching assessment calibration methods face challenges such as low integration efficiency when processing multi-source heterogeneous assessment data, insufficient adaptability across different disciplines and teaching scenarios, and biases in results with weak fairness guarantees. The research aims to construct an interpretable, transferable, and scalable fairness-correction framework for deep modeling and dynamic correction of teaching assessment data. These issues make it difficult to meet the core requirement of balanced teaching in intelligent education. This study proposes a fairness-oriented educational network algorithm that integrates a generative adversarial network and a gradient boosting decision tree. The algorithm constructs a fairness calibration mechanism and combines a bidirectional encoder representation model with a graph attention network to optimize feature extraction and dynamic adaptability, improving multi-source data processing efficiency and fairness calibration accuracy. This approach achieves precise calibration and fairness assurance in teaching assessments. In the indicator test, the model achieved an accuracy of 98.76% in clustering evaluation features, 98.05% in fairness correction, and 0.968 in cross-scenario correction consistency in the validation set. In the loss value testing task, the total loss of the model decreased from 0.1237 to 0.1018 during the teaching evaluation correction task in the validation set. In the indicator test, the model achieved an accuracy of 98.76% in clustering evaluation features, 98.05% in fairness correction, and 0.968 in cross-scenario correction consistency in the validation set. Experimental results indicate that the proposed model significantly outperforms comparative models, effectively addressing issues of poor multi-source data integration and fairness bias in existing calibration methods. Furthermore, it provides innovative algorithmic frameworks for technology developers and reliable technical tools for educational administrators to promote teaching equity. The research contributions lie in: (i) integrating three core modules, including multi-source data preprocessing, dynamic fairness index verification, and explainability visualization; and (ii) proposing a fairness correction paradigm based on the collaborative optimization of generative adversarial networks and gradient boosting trees, which breaks through the limitations of traditional single-model correction and enables decoupled learning of deviation modeling and correction decision-making.
Introduction
Loading...
$$\rightleftharpoonup{xx}$$
$$\longleftharp{xx}$$,
$$\longrightharp{xx}$$,
Teaching evaluation and calibration form the core of ensuring teaching quality in intelligent education. Through dynamic analysis, error correction, and result calibration, they provide a basis for instructional improvement and personalized learning. Their accuracy and fairness directly affect whether intelligent education can break through technological biases and provide balanced educational support1,2. However, existing methods have several shortcomings: they rely on a single data source, ignore the actual situation, and lead to data bias and correction bias. Lack of a dynamic fairness adaptation mechanism makes it difficult to meet the fairness needs of disciplines and scenarios3,4. In addition, there are issues such as a lack of fairness indicators and bias in correction strategies when dealing with heterogeneous data from multiple sources. To this end, scholars have conducted research from multiple dimensions, such as evaluating tennis-assisted teaching based on an improved dense trajectory algorithm5. Yin et al. utilized the analytic hierarchy process and a fuzzy synthesis algorithm to monitor online teaching6. Chen analyzed educational data for older adults using an improved data mining algorithm to enhance instructional quality7.
Although these studies have made progress, issues such as calibration result bias and poor fairness coordination remain. Therefore, constructing a model that simultaneously provides accurate teaching assessment calibration and dynamic fairness assurance has become a research focus in intelligent education. Generative adversarial network (GAN) adapts to eliminate the implicit influence of sensitive attributes on results through real-time adversarial training between the generator and discriminator, ensuring outputs are determined by core factors rather than label-induced bias8. GAN shows advantages in handling group biases in assessment data and modeling non-linear fairness constraints. Cheng et al. proposed a GAN-based image enhancement algorithm to address low-resolution images. The generator output high-resolution images from low-resolution inputs, and the discriminator distinguished the generated images from real high-resolution images. Adversarial training optimizes parameters so the generator output approaches real images9. Kang et al. proposed a cross-modal GAN model to improve multimodal data processing efficiency in renewable energy fields. The generator receives single-modal data, the discriminator distinguishes generated from real multimodal data, and adversarial training optimizes the model for improved efficiency10. The gradient boosting decision tree (GBDT) algorithm is a classic algorithm for structured data processing with strong feature capture capability. By iteratively integrating multiple decision trees, GBDT precisely learns data error patterns and shows advantages in processing multi-source heterogeneous assessment information and correcting non-linear score deviations11,12. Mizuno et al proposed a GBDT-based path prediction method for heavy rainfall disasters, learning path features and predicting disaster paths with real-time data, selecting optimal predictions through multiple decision trees13. Gao et al. developed a GBDT-based visual analysis method for advertising click-through rate prediction, learning the relationship between visual features and historical click data to predict click rates for new advertisements14. Based on the above challenges, this research aims to systematically answer the following core scientific question: How can an intelligent educational evaluation model be constructed to efficiently integrate multi-source heterogeneous data, dynamically adapt to different teaching scenarios, and simultaneously ensure calibration accuracy and result fairness. To answer this question, this study utilizes the synergistic effect of the fairness constraint mechanism of GAN and the precise error calibration ability of GBDT. Furthermore, research is conducted on how to introduce advanced technologies, such as natural language processing (BERT), reinforcement learning (RL), attention mechanisms (AM), long short-term memory networks (LSTM), graph attention networks (GAT), and knowledge distillation (KD), to compensate for the inherent limitations of a single model in feature extraction, dynamic adaptation, and reasoning efficiency. Ultimately, the goal is to provide a teaching assessment calibration solution that is both precise and fair, and has strong generalization capabilities for the field of intelligent education.
Access restricted. Please log in or start a trial to view this content.
Protocol
Loading...
$$\rightleftharpoonup{xx}$$
$$\longleftharp{xx}$$,
$$\longrightharp{xx}$$,
FairEduNet algorithm design and optimization
The study combines GAN and GBDT to construct the FairEduNet algorithm, achieving the dual goals of fairness correction and accuracy correction, rather than the trade-off of one-way optimization. FairEduNet adopts a dual-channel collaborative architecture: the GBDT backbone channel is responsible for structured error modeling and precise correction, while the GAN auxiliary channel focuses on decoupling sensitive attributes and dynamically adjusting fairness. The FairEduNet algorithm architecture, combining GAN and GBDT is shown in Figure 1.
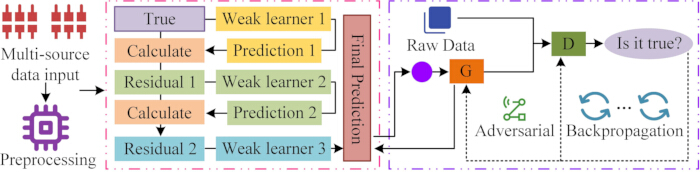
Figure 1: FairEduNet algorithm architecture combining GAN and GBDT. Please click here to view a larger version of this figure.
As shown in Figure 1, FairEduNet first collects and preprocesses multi-source assessment data. GBDT uses multiple decision trees to iteratively learn assessment error patterns, outputs initial calibration results, and passes them to the GAN module. GAN trains the discriminator to learn the relationship between initial calibration results and sensitive attributes, while the generator dynamically adjusts calibration parameters. Through multiple rounds of adversarial training and fairness verification, fairness bias is optimized. Finally, the fairness-calibrated results are fed back to the GBDT module, which adjusts for accuracy and fairness, outputting the teaching assessment calibration basis and report. GBDT calculates residuals as shown in Equation (1).
 (1)
(1)
In Equation (1),  represents the residual of the i-th sample in the t-th iteration, yi represents the true value, and
  represents the prediction value of the t-1-th iteration. The GAN adversarial process is shown in Equation (2).
 (2)
(2)
In Equation (2), x represents the initial calibration result, z represents sensitive attribute features, Pdata(x) represents the true distribution of non-sensitive features, Pz(z) represents the distribution of sensitive attributes, D represents the discriminator, and G represents the generator15. The initial calibration output of GBDT is shown in Equation (3).
 (3)
(3)
In Equation (3),  represents the prediction of the i-th sample by the initial decision tree, K represents the total number of decision trees, γk represents the weight of the k-th tree, and hk(xi) represents the prediction output of the k-th tree for the i-th sample. The FairEduNet algorithm can provide precise calibration and fairness assurance for teaching assessment data. However, when processing unstructured assessment data and adapting to dynamic scenarios, FairEduNet exhibits weak feature extraction capability for unstructured features, resulting in calibration bias. In addition, FairEduNet's fairness indicators and calibration parameters are statically set, limiting its adaptability to different teaching scenarios and affecting overall calibration quality. The combination of bidirectional encoder representations from transformers (BERT) and reinforcement learning (RL), the BERT-RL algorithm, can accurately extract deep features from unstructured text and dynamically adapt scenario parameters without manually setting static thresholds, further improving the reliability of algorithm outputs across scenarios16,17. Traditional methods like TF-IDF rely on word frequency but lack deep contextual understanding and cannot distinguish specific directions of "fairness" in different scenarios. Word2Vec produces static word vectors, which struggle to adapt to complex contextual changes and recognize indirect bias. BERT uses multi-layer self-attention to encode bidirectional context, capturing both explicit biased terms and implicit biased logic. Traditional approaches require manually constructed bias word lists, depend on subjective experience, and cover limited scenarios. Through pre-trained model transfer learning, BERT automatically learns deep semantic features without extensive manual effort, offering stronger generalization in recognizing ambiguous bias. Moreover, traditional methods often lose information with long texts, while BERT supports up to 512 tokens, preserving contextual relationships, accurately locating bias features, and enabling fine-grained fairness correction. The operation process of BERT-RL is shown in Figure 2.
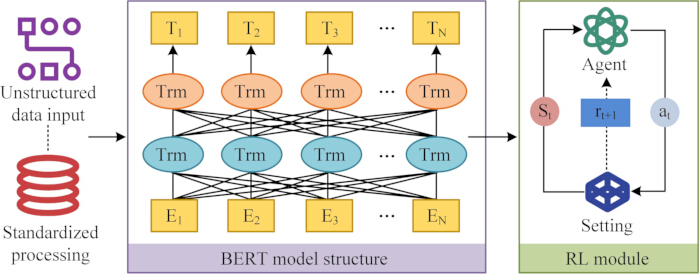
Figure 2: BERT-RL algorithm operation flow chart. Please click here to view a larger version of this figure.
As shown in Figure 2, BERT-RL first standardizes unstructured text assessment data and inputs it into the BERT model. BERT uses a Transformer encoder for bidirectional semantic modeling to extract key features and construct a feature matrix. The feature matrix is then input into the RL module, which learns the optimal strategy through multiple iterations. The optimized parameter configuration is finally fed into FairEduNet, improving its adaptability. The BERT self-attention feature weight calculation is shown in Equation (4).
 (4)
(4)
In Equation (4), dk represents the dimension of vector K. The RL multi-objective reward function is expressed in Equation (5).
 (5)
(5)
In Equation (5), ω1, ω2, and ω3 represent weight coefficients,  represents calibration error, Dt is fairness deviation, Dtarget is target fairness deviation, and Tt is runtime18. This study combines BERT-RL with FairEduNet to form the BERT-RL-FairEduNet algorithm, referred to as BFEN. BFEN achieves precise calibration and fairness assurance of teaching assessment data through GBDT feature iteration and GAN real-time adversarial training, while BERT-RL optimizes FairEduNet in handling unstructured data and dynamically adapting to scenarios, addressing weaknesses in feature extraction and static parameter limitations. The study used the BERT-base-Chinese model, and pre-trained the corpus of real teaching logs, classroom recorded texts, and educational policy documents from the National Smart Education Platform for the academic year 2024 to 2025, with a vocabulary size of 21128. The hidden layer dimension of the model is 768, with 12 attention heads and 12 layers. The depth of the GBDT tree was set to 8, the number of trees was 200, and the learning rate was 0.1. The training cycle of GAN is 150 rounds, and the discriminator uses a 3-layer fully connected network with sizes of 512, 256, and 1. The generator uses a 4-layer fully connected network with sizes of 1024, 512, 256, and 1. The number of hidden units in LSTM is 128, and the sequence length is 512. GAT has 2 layers and 4 attention heads. The temperature for knowledge distillation is set to 3.0. RL reward weight coefficients ω1 = 0.4, ω2 = 0.35, and ω3 = 0.25. The weight selection criteria are to balance the Pareto front equilibrium of multi-objective optimization with the interpretability requirements of educational equity practices. The experiments were completed using a 50% data split through cross-validation and hyperparameter tuning. The BFEN process for teaching assessment calibration is shown in Figure 3.
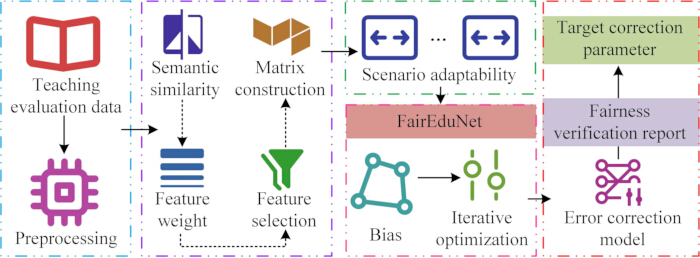
Figure 3: Correction process of the BFEN algorithm for intelligent education and teaching evaluation. Please click here to view a larger version of this figure.
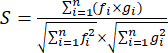
As shown in Figure 3, BFEN first preprocesses multi-source teaching assessment data. BERT optimizes FairEduNet's feature extraction capability by calculating text semantic similarity and deep feature weights based on a semantic window, selecting important features to construct a high-dimensional semantic feature matrix. RL then sets a multi-objective reward function and computes scenario adaptability and parameter adjustment gradients to further optimize fairness thresholds and calibration parameters. FairEduNet calculates deviations between assessment data and error pattern models, iteratively updates decision tree weights, and adjusts calibration strategies until errors stabilize within preset thresholds. The final output includes the error calibration model and the fairness verification report. The calibration model is applied to teaching assessment data, generating pre- and post-calibration comparison tables, which are combined with the intelligent education fairness standard library to determine target calibration parameters, providing a scientific basis for teaching assessment calibration in intelligent education. This standard library covers three dimensions of educational opportunity fairness, process fairness, and outcome fairness, and includes 12 core indicators. These indicators include the balance of educational resource allocation between regions, the difference in digital infrastructure coverage between urban and rural schools, the tolerance threshold for delayed response to learning situation diagnosis (≤200 ms), the tolerance for missing data in multimodal assessment (≤3.5%), the sensitivity of algorithm bias detection (AUC deviation for gender/region/stage labeling ≤ 0.02), the KL divergence threshold for score distribution before and after correction (≤0.08), the interpretability score of teacher intervention suggestions (≥4.2/5.0), the timeliness of student profile updates (completed within T + 1 days), the consistency coefficient of cross-platform credit recognition (≥0.93), the accuracy of education policy semantic alignment (BERT score ≥ 0.86), and the completeness of fairness verification report generation (including bias attribution, confidence intervals, and reproducible parameter snapshots), as well as the dynamic scenario adaptation validation pass rate covering three typical scenarios: live classroom, asynchronous assignments, and AI teaching assistants. The semantic feature similarity calculation is shown in Equation (6).
 (6)
(6)
In Equation (6), fi represents the value of the i-th semantic feature dimension, gi represents the value of the i-th important assessment feature dimension, and n represents the total number of feature dimensions. The RL scenario adaptation parameter calculation is shown in Equation (7).
 (7)
(7)
In Equation (7), θt represents the parameter value at the t-th iteration, α represents the learning rate, and  represents the parameter gradient based on reward function R(θt).
Teaching assessment calibration model construction
Although BFEN demonstrates certain advantages in teaching assessment calibration, it still faces low integration efficiency for multi-source heterogeneous assessment data and insufficient dynamic fairness adaptation in practical applications. The AM-LSTM algorithm, which combines Attention Mechanism (AM) and Long Short-Term Memory (LSTM), assigns weights to key features of multi-source assessment data through AM and captures the dynamic change patterns of assessment data over time using LSTM's sequential memory capability. This approach effectively improves multi-source data integration efficiency and dynamic feature learning19,20. The operation process of AM-LSTM is shown in Figure 4.
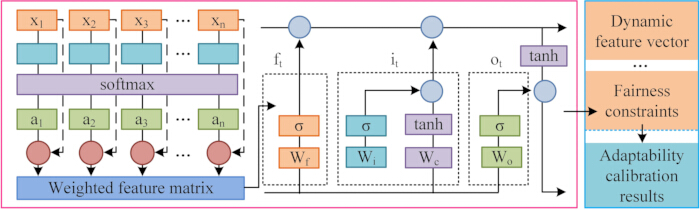
Figure 4: AM-LSTM operation flow chart. Please click here to view a larger version of this figure.
As shown in Figure 4, AM-LSTM first preprocesses multi-source heterogeneous teaching assessment data to form a standardized dataset. AM calculates attention weights for features from different data sources to select important features and constructs a weighted feature matrix. The weighted feature matrix is then input into LSTM, which uses its gating mechanism to learn dynamic patterns over time, capturing relationships among assessment data at different stages and outputting dynamic feature vectors. Finally, these dynamic feature vectors are combined with fairness constraints to generate intermediate calibration results that adapt to multi-source data integration and dynamic scenarios, providing a basis for subsequent model optimization. Attention weight calculation is shown in Equation (8).
 (8)
(8)
In Equation (8), an represents the attention allocation for the n-th feature, xn represents similarity, q represents the query vector, and softmax represents the activation function. The LSTM forget gate is expressed in Equation (9).
![LSTM forget gate equation \( f_t = \sigma (W_f[h_{t-1}, x_t] + b_f) \).](/files/ftp_upload/70189/70189eq93.jpg "figure-protocol-18") (9)
(9)
In Equation (9), Wf is the forget gate weight, bf is the forget gate bias, xt is the input at time t, ht-1 is the external state variable at time t-1, and σ represents the sigmoid function21. This study combines AM-LSTM with BFEN to construct the AM-LSTM-BFEN teaching assessment calibration model, referred to as FBFEN. In this model, AM-LSTM addresses BFEN's limitations in multi-source heterogeneous data integration efficiency and dynamic feature extraction. It also integrates fairness constraints to optimize intermediate calibration results, enabling BFEN to further achieve precise calibration and dynamic fairness assurance for teaching assessment data. The operation process of FBFEN is shown in Figure 5.
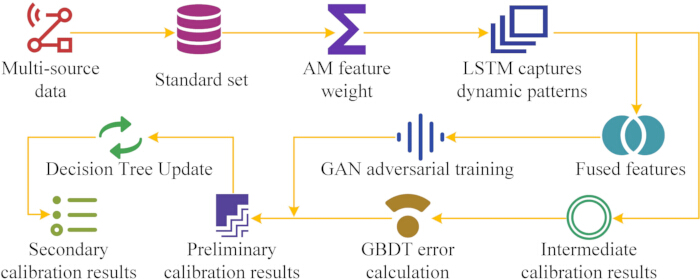
Figure 5: Operation process of the FBFEN teaching evaluation and correction model. Please click here to view a larger version of this figure.
As shown in Figure 5, FBFEN first preprocesses the original multi-source teaching assessment data and inputs the standardized dataset into the AM-LSTM module. AM calculates feature attention weights, while LSTM learns dynamic patterns, outputting intermediate calibration results that integrate multi-source information and dynamic features. The intermediate results are then input into the BFEN module. GBDT iteratively learns the error patterns of assessment data based on the intermediate results and the preset error model, outputting preliminary calibration results. Meanwhile, GAN analyzes fairness bias caused by sensitive attributes in the preliminary results through adversarial training between the generator and discriminator, dynamically adjusting calibration parameters to eliminate bias. Finally, the GAN-optimized calibration parameters are fed back to GBDT to update decision tree weights and calibration strategies, producing a secondary calibration result that balances precision and fairness. Data standardization is expressed in Equation (10).
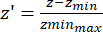 (10)
(10)
In Equation (10), z' represents the standardized value, z represents the original value, and zmin and zmax represent the minimum and maximum values. The final objective function of the GAN generator is expressed in Equation (11).
 (11)
(11)
In Equation (11), N represents the number of iterations, λ represents the loss weight factor, ωi represents the weight factor of the i-th iteration,  represents the adversarial loss function, and
  represents the binary cross-entropy loss22.
FBFEN teaching assessment calibration model optimization
Although FBFEN demonstrates strong multi-source data integration and dynamic fairness assurance in teaching assessment calibration, it still faces weak feature correlation and low training and inference efficiency due to the complex model structure in complex educational scenarios. The GAT-KD algorithm, which combines Graph Attention Network (GAT) and Knowledge Distillation (KD), dynamically constructs a semantic association graph among features through GAT's attention mechanism, enhancing the semantic alignment of multi-source data. KD compresses the knowledge of the complex model into a lightweight network, significantly improving inference efficiency while maintaining model performance23,24. The operation process of GAT-KD is shown in Figure 6.
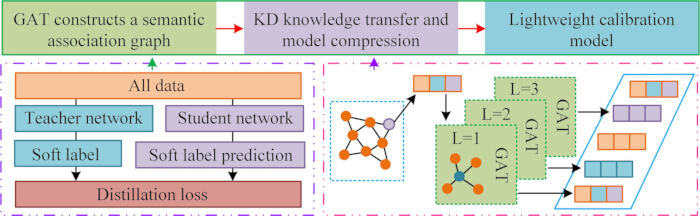
Figure 6: GAT-KD operation flow chart. Please click here to view a larger version of this figure.
As shown in Figure 6, GAT-KD constructs a semantic association graph among features through the GAT module, dynamically aggregates neighborhood feature information using the attention mechanism, and enhances the semantic representation of local features. KD then uses the output soft labels as supervision signals, minimizing divergence loss between output distributions and cross-entropy loss between its predictions and true labels, achieving knowledge transfer and model compression. The final output is a lightweight calibration model with high precision and efficiency. GAT attention coefficient calculation is shown in Equation (12).
 (12)
(12)
In Equation (12),  and
and  represent the feature vectors of nodes i and j, W represents the learnable weight matrix, a represents the attention weight vector,
  represents the concatenation operation, and LeakyReLU represents the activation function25. KD loss function calculation is shown in Equation (13).
 (13)
(13)
In Equation (13), KL represents the divergence loss, T2 represents the gradient scaling balance, pstudent represents the soft label probability of the lightweight model, and pteacher represents the soft label probability of the complex model26. By combining attention-enhanced feature association and lightweight knowledge transfer, GAT-KD effectively addresses feature semantic bias and high computational complexity. This study integrates GAT-KD into FBFEN to form the GAT-KD-FBFEN teaching assessment calibration model, referred to as GFBFEN. GAT-KD optimizes FBFEN's shortcomings in incomplete multi-source feature correlation capture and low inference efficiency. The operation process of GFBFEN is shown in Figure 7.
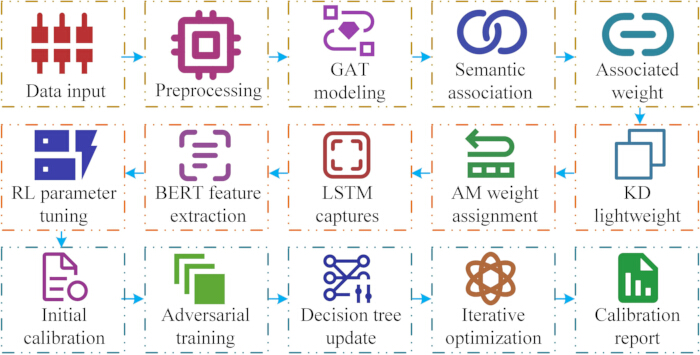
Figure 7: GFBFEN teaching evaluation and correction model operation process. Please click here to view a larger version of this figure.
As shown in Figure 7, GFBFEN standardizes multi-source teaching assessment data. GAT models complex relationships among features and dynamically calculates semantic association weights between nodes using attention mechanisms. KD compresses the knowledge of the complex model into a lightweight network, significantly improving inference efficiency while maintaining precision. The AM-LSTM module assigns importance weights to multi-source features and captures temporal dynamic patterns of assessment data, outputting intermediate calibration results that integrate multi-source information. These results are input into the BFEN module for deep processing. Specifically, BERT extracts semantic features from unstructured text, RL dynamically optimizes fairness thresholds and calibration parameters, GBDT iteratively learns error patterns for preliminary calibration, and GAN eliminates biases caused by sensitive attributes through adversarial training. The dynamic parameter adjustment mechanism automatically calibrates the response sensitivity and fairness weights of each module by sensing the temporal changes and group distribution shifts of the teaching scene in real time, thereby solving the problem of insufficient adaptability caused by static parameter configuration, and ensuring that the model can maintain robustness and fairness in different teaching stages, student groups, and evaluation scenarios. The evaluation type directly affects the granularity and feedback cycle of time series modeling, while formative evaluation emphasizes the dynamic nature of the process. The differences in disciplines determine the allocation of features between BERT and GBDT modules. Therefore, adopting a dynamic adjustment mechanism can effectively adapt to different evaluation types and disciplinary characteristics. Finally, through multiple rounds of parameter feedback and iterative optimization, the model outputs precise and fair teaching assessment calibration results. The dynamic fairness constraint optimization function is expressed in Equation (14).
 (14)
(14)
In Equation (14), S represents the set of sensitive attributes,  represents the predicted output calibration result,
  represents the variance of predictions within groups, γ represents inter-group parameters, and
 ![Expected value equation E[ȳ] symbol, statistical analysis concept, formula representation.](/files/ftp_upload/70189/70189eq165.jpg "figure-protocol-34") represents the overall expected value. The adaptive calculation of multi-source feature fusion weights is shown in Equation (15).
represents the overall expected value. The adaptive calculation of multi-source feature fusion weights is shown in Equation (15).
 (15)
(15)
In Equation (15), wk represents the feature weight of the k-th data source, β represents the weight parameter, Sim represents the feature similarity measurement function, fk represents the feature vector extracted from the k-th data source, fglobal represents the global feature center, and K represents the total number of data sources. The study set the weights of sensitive attributes, including gender, ethnicity, region, family economic status, and mother tongue background. The weights are determined based on the results of correlation analysis. The study used the Pearson correlation coefficient and Spearman rank correlation coefficient as dual indicators for joint evaluation, combined with expert experience in the field of education for weight calibration. The final determination of the weights for each sensitive attribute yielded values of 0.18 for gender, 0.22 for ethnicity, 0.25 for region, 0.19 for family economic status, and 0.16 for mother tongue background. Gender: Gender identity per legal registration and self-identification, binary (male/female) with non-binary options; data field "gender". Ethnicity: Based on national ethnic identification of 56 groups, compatible with unidentified and cross-border groups; data field "ethnicity". Region: Administrative division of household registration or long-term residence, covering provincial, municipal, and county levels, considering urban-rural dual structure and migrant population; data field "region". Family economic status: According to national statistical standards and education assistance indicators, using a five-level classification; data field "economic_status". Mother tongue background: Primary teaching and family communication language during basic education, covering Mandarin, minority languages, dialects, and foreign languages, weighted by acquisition age and frequency; data field "mother_tongue."
The correction process adopted a three-stage dynamic weighting mechanism. The first stage implemented initial deviation identification based on the weight matrix of sensitive attributes, marking data points that significantly deviated from the global feature center in dimensions such as gender, ethnicity, and region. The second stage introduces educational context constraints to re-qualify the deviation intensity in a context-aware manner. The third stage verifies the correction stability through counterfactual perturbation tests, systematically replacing the values of sensitive attributes while keeping non-sensitive features unchanged, and observing whether the change in evaluation scores is within the ±±3.2% threshold.
Access restricted. Please log in or start a trial to view this content.
Results
Loading...
$$\rightleftharpoonup{xx}$$
$$\longleftharp{xx}$$,
$$\longrightharp{xx}$$,
BFEN algorithm performance analysis
The indicators evaluated in the experiments included the following:
Evaluation correction accuracy (ECA) denotes the proportion of deviation items correctly identified and rectified by the model within the teaching assessment results, thereby reflecting the overall effectiveness of the correction mechanism. Higher values indicate superior correction accuracy.
Fairness deviation rate (FDR) measures the magnitud...
Access restricted. Please log in or start a trial to view this content.
Discussion
Loading...
$$\rightleftharpoonup{xx}$$
$$\longleftharp{xx}$$,
$$\longrightharp{xx}$$,
The BFEN algorithm proposed in this study demonstrated superior performance in comparative experiments. From the perspectives of ECA and FDR, it significantly outperformed PRF, EAB, and DBLR algorithms. When calibrating 421 assessment records, BFEN increased ECA to 98.75% and maintained stability, while FDR decreased to 2.87%. This performance resulted from the integration of BERT-RL for feature optimization and dynamic adaptation. BERT precisely extracted deep semantic bias information from unstructured assessment texts...
Access restricted. Please log in or start a trial to view this content.
Disclosures
Loading...
$$\rightleftharpoonup{xx}$$
$$\longleftharp{xx}$$,
$$\longrightharp{xx}$$,
The author has nothing to disclose.
Acknowledgements
Loading...
$$\rightleftharpoonup{xx}$$
$$\longleftharp{xx}$$,
$$\longrightharp{xx}$$,
The author declares that there is no conflict of interest.
Access restricted. Please log in or start a trial to view this content.
Materials
| Name | Company | Catalog Number | Comments |
|---|---|---|---|
| Global Education Monitoring Report dataset | UNESCO | https://www.education-progress.org/ | Dataset |
| NumPy | NumPy | https://numpy.org/ | Data preprocessing |
| Pandas | Pandas, NumPy | https://pandas.pydata.org/ | Data preprocessing |
| PyCharm Professional 2023.1 | PyCharm | Version 2023.1 | Development environment |
| Python 3.9 | Python | Version 3.9 | Programming language |
| Scikit-learn | Scikit-learn | https://scikit-learn.org/stable/index.html | Machine Learning |
| Seaborn | Seaborn | https://seaborn.pydata.org/ | Visualization |
| Spanish middle school student academic performance dataset | UC Irvine Machine Learning Repository | https://archive.ics.uci.edu/dataset/320/student+performance | Dataset |
| TensorFlow | TensorFlow | https://www.tensorflow.org/ | Deep Learning |
| Windows 11 | Microsoft | Version 11 | Operating System |
Reprints and Permissions
Request permission to reuse the text or figures of this JoVE article
Request Permission